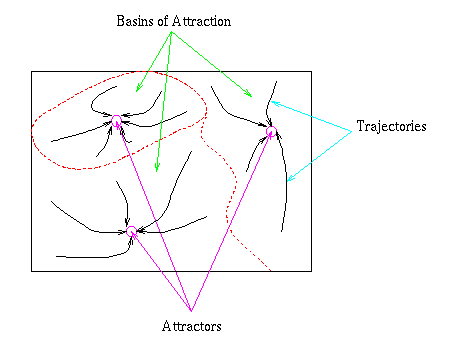
Figure 1: Attractors, basins of attraction and trajectories.
Introduction
The Hopfield network (Hopfield 1982; Hopfield 1984) demonstrates how
the mathematical simplification of a neuron can allow the analysis of
the behaviour of large scale neural networks. By characterizing
mathematically the effect of changes to the activation of individual
units on a property of the entire neural architecture called
energy, Hopfield (1982) provided the important link between
local interactions and global behaviour. In this chapter, we will
explore the idea of energy and demonstrate how Hopfield architectures
"descend on an energy surface". We start by providing an overview of
the purpose of the Hopfield network. Then we outline the architecture
including the threshold activation function, asynchronous updating and
hebbian learning. Finally, we explain how a Hopfield network is able to
store patterns of activity so that they can be reconstructed from
partial or noisy cues.
Suppose we have a large plastic sheet that we want to lay as flat as possible on the ground. To lay our sheet we employ a cyclic procedure. Firstly, we find a low point on it. Then we build up that section by placing sand underneath it. Then we find another low point and build it up; continuing until we are satisfied that the sheet is flat enough. How might we go about finding the low points? One possibility would be to place a drop of mercury on the sheet and watch as it rolls down the sheet. The point where it stops is low (although possibly not the lowest on the entire sheet) and would be a good candidate for raising. The idea of the state of a system (position of the mercury) descending on an energy surface (the plastic sheet) is a recuring one in the field of neural networks - both for describing changes to activations as a consequence of cycling and changes to weights as a consequence of learning. Figure 1 shows a schematic of our plastic sheet. The low points are the attractors. The region within which the drop will fall to a given attractor is its basin of attraction and the paths taken by the drop are called trajectories.
Figure 1: Attractors, basins of attraction and trajectories.

| 
| 
|
| 
| 
|
| Original | Degraded | Reconstruction |
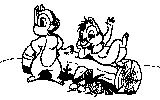
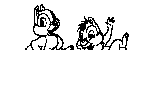
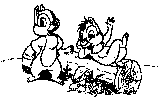
Figure 2 shows the results of a Hopfield network which was trained on the Chipmunk and Bugs Bunny images on the left hand side and then presented with either a noisy cue (top) or a partial cue (bottom). The images on the right hand side have been reconstructed by the Hopfield network. Notice that even in the face of substantial degradation the network is able to reconstruct a very close approximation to the original image. The quality of the network's reconstruction depends on the similarity of the stored images and the number of images that are stored given the size of the network.
Figure 3: The "Noisy Two" pattern on a Hopfield Network.
The Hopfield Network
In a Hopfield network all units are connected to all of the
other units and the units are activated at either 1 or -1. To see
the conenction structure make the weight visible in figure 3.
The Threshold Activation Function and Asynchronous Updating
The Hopfield transfer function involves the same net input term which
occurs in many neural architectures (see chapter 2):
 wijai
wijai
wijai)
| sgn(x) = | 1 if x >= 0 |
| -1 if x < 0
|
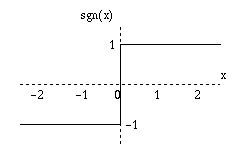
Figure 4: The sgn function.
You have already observed asynchronous updating in exercise one. On each cycle a new unit is selected and the update rule is applied. Of course, much of the time the units activation before and after update is the same and so you see no change. On some occasions, however, the activation of the unit flips from red to blue or vice versa.
Hebbian Learning: The Storage of Stable Patterns
The Hopfield network employs Hebbian learning. This form of learning is
a mathematical abstraction of the principle of synaptic modulation first
articulated by Hebb (1949). Hebb's law says that if one neuron
stimulates another neuron when the receiving neuron is firing, the
strength of the connection between the two cells is strengthened.
Mathematically this is expressed as:
 wij = ai aj
That is, the change in a weight is equal to the product of the activations of the units which it connects. So if both units are on (ai = 1) or both units are off (ai = -1) the strength of the weight is increased, otherwise it is decreased. Note that the mathematical expression goes beyond Hebb's Law in that it allows for a weight to increase if both units are off and to decrease if the activations of its units are 1 and -1. These properties are probably not physiologically justified and can be modified, however the system is easiest to understand if the simple Hebbian rule is applied.
The important property of Hebbian learning as far as the Hopfield network is concerned is that if we instantiate a pattern on the array of units and apply the above rule that pattern becomes an attractor of the network. Subsequently, if the pattern of activation of the network is close to a stored pattern it will tend to migrate to that pattern. Furthermore, once it arrives at the attractor it will remain there indefinitely - the attractors are stable.
Exercise 2: To confirm that the stored patterns are stable return to network above. Turn the weights back on (using the Weights Visible item in the Options menu) and zero the weights. The weights should all be black indicating that they have been set to zero. Now click on the Learn button once. Doing this cycles through each of the patterns in the Output Set instantiating each on the units and then applying the Hebbian learning rule (this happens behind the scenes - you wont see it on the screen). Be sure to only do this once. Doing it more than once will cause the weights to become larger. While this has no affect on the processing of the network it will affect the Energy values which you will be recording. If you accidently click Learn more than once, zero the weights and start again.
Examine the self weights. You will ntoice that they are all equal. What is their value and why?
Now test each of the patterns in the Output Set by reseting the graph, clicking on the pattern (One through to Four) and then clicking on Cycle. Notice that the patterns do not change and the Energy starts at a low value and remains there. Record the Energy of each pattern.
| Pattern | Energy |
|---|---|
| One | |
| Two | |
| Three | |
| Four |
In the next section we will discuss why the Hebbian learning rule leads to stable attractors at the stored patterns. The discussion contains some mathematics and can be omitted on a first reading.
Why are stored patterns stable?
To understand why the Hebbian rule produces stable patterns we will
start by considering a network which has stored just one pattern. For
this pattern to be stable:
wijai) = aj for all j
because then the transfer function produces no changes. Now with only one pattern stored (that being the pattern currently on the units):
| sgn( wijai)
| = sgn( aj ai ai) |
| = sgn(n aj) | |
| = aj for all j
|
Furthermore, provided at least half of the units in the starting pattern have the correct value sgn(neti) will give the correct value and the network will converge to the stored pattern - so the pattern is an attractor of the network.
In this simple case there are actually two attractors. The second one is the inverse of the stored pattern - the reverse state. If more than half of the units in the starting pattern are different from the stored pattern then the network will end up in the reverse state.
Exercise 3: These reversed attractors are also present when more than one pattern has been stored. To confirm this reset the network and select the "Inverse Two" pattern from the Test Set. Now cycle the network. Note the reversed state is stable. What is the value of the energy? How does it compare against that of the original pattern?
The discussion above holds if there is only one pattern stored, but what if there are more patterns? According to the Hebbian update rule:
u=1..p auiauj
where u ranges over all of the stored patterns of which there are p and aui is the value of unit i in pattern u.
Now the stablity condition is:
j wij avj =
j u aui
auj avj
Now if we separate out the case where u = v we get:
j ¬ u = v aui
auj avj
where ¬ u = v is read as u not equal to v.
If the absolute value of the second term (i.e. the crosstalk term) is less than n then the pattern will be stable and the pattern will act as an attractor for states close to it. This is often the case particularly if the number of patterns is small compared to the number of units. In fact, it can be shown that for randomly created patterns performance will be good provided the number of patterns is less than 0.138 by the number of units. The proof of this result is beyond the scope of this text, but interested students are referred to Hertz, Krogh and Palmer (1991) for the details.
Descent on an Energy Surface
In the introduction we presented the analogy of an energy surface which
underpins the analysis of many neural networks and during the course of
the exercises so far we have referred to the Energy value. In this
section we will define the energy value and demonstrate why the
Hopfield activation equation causes it to decrease. Then we will look
at the behaviour of the network when presented with partial and noisy
cues.
The energy function of interest for Hopfield networks and which we have been using to this point is:
ij wij aiaj
To see that the stored patterns will be low points in the energy landscape consider the contribution of a single pattern (u) to the energy when that pattern is instantiated:
| H = | -1/2ij wuij auiauj
|
| = -1/2 ij auiauj auiauj
| |
| = -1/2 n2 |
Any departure of the current pattern from the stored pattern could lead to a negative term in the sum which would increase the entire energy. Exactly what the energy will be depends on the extent to which the stored patterns overlap. In general, however, the stored patterns will be low in energy.
The main property of the energy function is that it always decreases or stays
constant as the network cycles. The next section demonstrates mathematically
why this function will always decrease. It can be omitted on a first reading.
Why does energy always decrease?
The Hebbian learning rule produces weight patterns that are symmetric.
The easiest way to see this is to compare wij which is ai aj
and wji which is aj
ai. Since the changes are the same and the weights are
initialized to zero the pattern remains symmetric. This allows us to
write the energy equation as:
(ij) wij ai aj
where (ij) means all of the distinct pairs ij - so the pair 12 is the same as pair 21. The constant term C accumulates the (ii) pairs and is a constant which only depends of the number of units. Now consider the affect of an activation update on the energy. Suppose ai is the new value of ai. If ai = ai then the energy does not change. If ai = - ai we can express the change in energy as (looking at only those terms containing ai since it is the only thing changing):
| H - H | = C - ¬ i = j wij ai aj - (C - ¬ i = j wij ai aj)
|
| = 2 ai ¬ i = j wij aj
| |
| = 2 ai j wij aj - 2 wii
|
j wijai)
j wijai)
j wij
aj must be negative. Also wii is equal to the
number of patterns, so - 2 wii is also negative so the
energy must decrease.
Partial and Noisy Cues
As outlined above the Hopfield network can be used to reconstruct
partial and noisy patterns. In the introduction the Bugs Bunny and
Chipmunk images were degraded by removing a section or applying uniform
noise. These images were then reconstructed producing quite good approximations
to the original patterns. In the final exercise you will use the
attractors network to reconstruct the number patterns from similar
partial and noisy cues.
Exercise 4: Your task is to complete the following table of energy values. In each case, reset the network and select the appropriate pattern from the Test Set. Do one cycle and record the energy value. Then complete another 100 cycles (or until the pattern is complete) and record the energy value at that point.
| Pattern | Starting Energy | Final Energy |
|---|---|---|
| Cut Off One | ||
| Cut Off Four | ||
| Noisy One | ||
| Noisy Two | ||
| Noisy Three | ||
| Noisy Four |
Hebb, D. O. (1949). The Organization of Behavior. New York: Wiley. Partially reprinted in Anderson and Rosenfeld (1988).
Hertz, J., Krough, A., & Palmer, R. G. (1991). Introduction to the theory of neural computation. Addison-Wesley, Redwood City, CA.
Hopfield, J. J. (1982). Neural networks and physical systems with emergent collective computational abilities. In Proceedings of the National Academy of Sciences, pp. 2554-2558. National Academy of Sciences.
Hopfield, J. J. (1984). Neurons with graded response have collective computational properties like those of two-state neurons. In Proceedings of the National Academy of Sciences, pp. 81:3088-3092. National Academy of Sciences.
 The Connectionist Models of Cognition homepage.